
Monthly Market Report · Condos/Townhomes
Burbank, CA Real Estate Market Report: Condos/Townhomes,
Report Month: October 2026
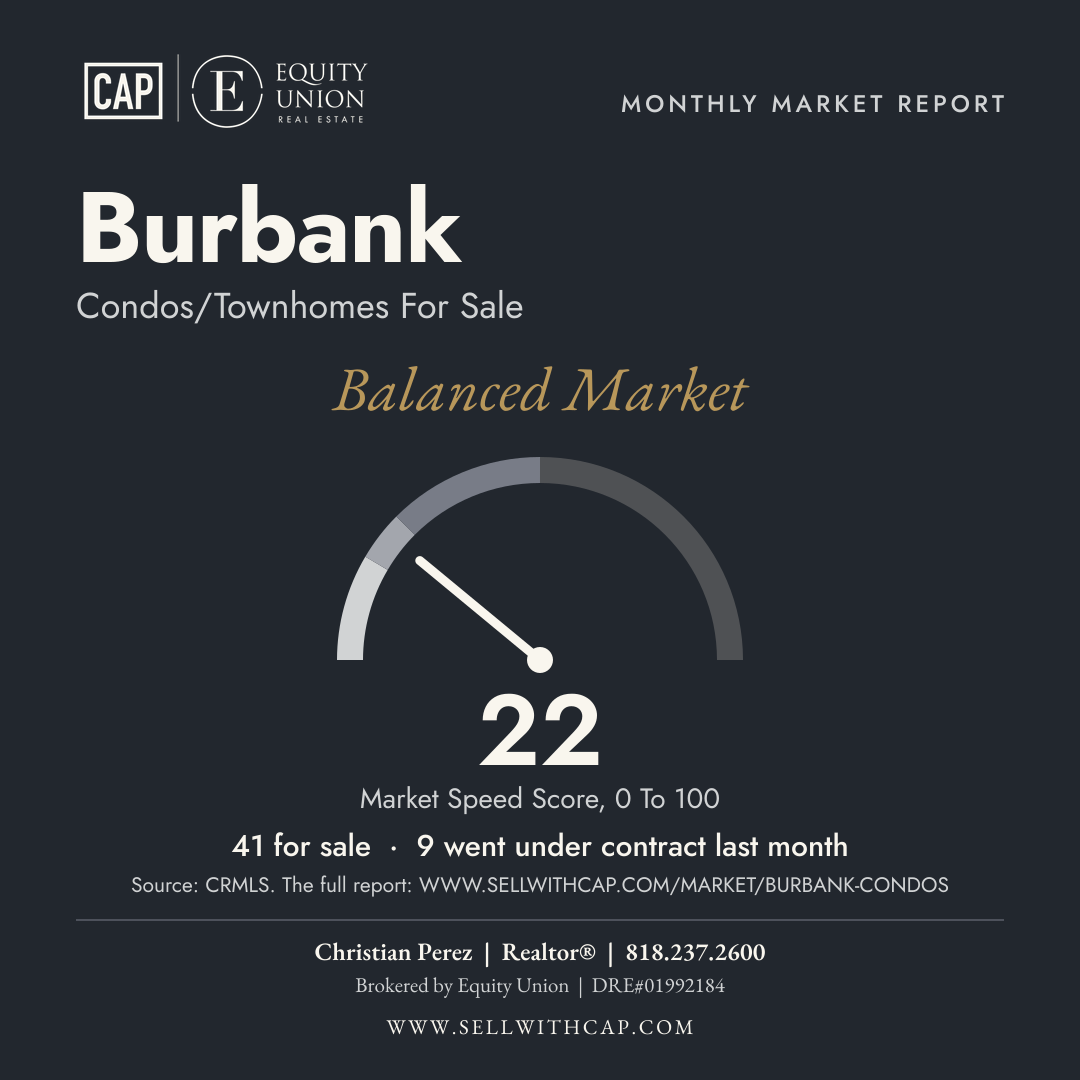
As of November 3, 2026, the median list price for condos/townhomes for sale in Burbank is $769,000, and the Market Speed Score is 22. There are 41 homes for sale.
Burbank, CA · Source: CRMLS · Updated on the 3rd of every month
At A Glance
Burbank: Homes For Sale And October Sales
On The Market On November 3, 2026
Every home for sale (active) in the MLS on November 3, 2026, the day this report was pulled.
- Condos/Townhomes For Sale
- 41
- Median List Price Of Homes For Sale
- $769,000
- Price Per Square Foot
- $567
- Median Days On Market
- 50 daysAverage: 64 days
Sold And Under Contract In October
Homes that sold, went under contract or came on the market from October 1, 2026 to October 31, 2026.
- Went Under Contract In October
- 9On the market a median of 70 days
- New Listings In October
- 17Median list price $769,000
- Closed Sales In October
- 10Homes that finished selling that month (MLS)
- Median Sale Price Of Homes Sold In October
- $684,500What they sold for, not what they were listed for
- Closed Homes: Median Days On Market
- 56 days
10 condos/townhomes closed in October. On November 3, 2026, 41 were for sale.
As of November 3, 2026 · Source: CRMLS
Market Speed Score
Balanced Market
22 out of 100
The Market Speed Score is 22 out of 100: Balanced Market. 9 homes went under contract in October 2026, and 41 homes are for sale now.
Homes that went under contract during the month, divided by the homes for sale on the report date, times 100 (100 at most). Under contract: homes the MLS marked Pending or Under Contract that month. Withdrawn and expired homes are not counted.
What Changed
The Month In Detail
Price
As of November 3, 2026, the median list price of the 41 condos/townhomes for sale in Burbank is $769,000.
Price Per Square Foot
The median list price per square foot is $567. Price per square foot puts homes of different sizes on the same scale.
Days On Market
The homes for sale have been on the market for an average of 64 days, and half of them for 50 days or fewer. The 9 homes that went under contract in October 2026 were on the market for a median of 70 days. 42% of the homes for sale are listed below their original price.
Homes For Sale
There are 41 homes for sale in Burbank now. In October 2026, 17 new listings came on the market and 9 homes went under contract.
As of November 3, 2026 · Source: CRMLS
Market Profile
This month's figure for every measure in this report.
- Median List Price
- $769,000
- Median Price Of New Listings
- $769,000
- Price Per Square Foot
- $567
- Average Days On Market
- 64 days
- Median Days On Market
- 50 days
- Listed Below Original Price
- 42%
- Listed Above Original Price
- 0%
- Relisted
- 10%
- Homes For Sale
- 41
- Market Speed Score
- 22
Price Segments
The Four Price Segments
Each segment is about 25% of the condos/townhomes for sale on November 3, 2026, sorted by list price.
| Segment | Median Price | Sq Ft | Lot Sq Ft | Beds | Baths | Age (Years) | New | Under Contract | Days On Market |
|---|---|---|---|---|---|---|---|---|---|
| Top 25%11 homes · $853,000 to $1,337,990 | $975,000 | 1,770 | 7,500 to 54,500 | 3 | 3 | 23 | 4 | 2 | 34 |
| Upper 25%10 homes · $769,000 to $850,000 | $794,000 | 1,389 | 8,000 to 28,000 | 3 | 3 | 40 | 4 | 2 | 71 |
| Lower 25%10 homes · $650,000 to $759,000 | $718,000 | 1,264 | 15,000 to 84,000 | 2 | 2 | 46 | 3 | 2 | 57 |
| Bottom 25%10 homes · $495,000 to $645,000 | $599,500 | 1,102 | 17,000 to 74,000 | 2 | 2 | 50 | 4 | 3 | 59 |
Medians for each segment, about 25% of the homes for sale each. New: listings that came on the market that month. Under Contract: homes from the segment that went under contract that month. Age: years since the home was built.
As of November 3, 2026 · Source: CRMLS
Get It Monthly
Get This Report Every Month
The Burbank Report In Your Inbox
Every month: the median list price, how fast homes are going under contract, and how many homes are for sale in Burbank. Free, from me, Christian Perez.
What's My Home Worth In This Market?
This report covers every condo/townhome for sale in Burbank. Your home's value depends on its condition, its updates and how it's prepared. Tell me where it is, and I'll send you a realistic range for today's market.
Rather talk it through? Book A Free Discovery Call.
Share Or Print This Report
Send This Report To A Contact
Only you see this (your recorder key is on this device). Pick an MM contact: their link tells you when they open the report, and 3 visits in 30 days sends you an alert.
For an MM email: (https://www.sellwithcap.com/market/burbank-condos?c={{contact.id}})
How This Report Works
- The data. On the 3rd of every month we take a snapshot of the condos/townhomes for sale in Burbank from the MLS (CRMLS). This report covers 1 month, since October 2026.
- Two windows. This Month is the month's figure. 3-Month Average is the average of the last 3 monthly figures.
- The Market Speed Score. Homes that went under contract during the month, divided by the homes for sale on the report date, times 100 (100 at most). 0 to 16: Buyer's Market. 17 to 24: Balanced Market. 25 to 49: Seller's Market. 50 to 100: Strong Seller's Market.
- Under contract. Homes the MLS marked Pending or Under Contract that month. Withdrawn and expired homes are not counted.
- Reported, not predicted. Every figure is what the MLS showed that month. Nothing on this page is a forecast.